Uncertainty in estimating fertiliser N requirements is large, with differences between recommended and measured N optima frequently exceeding 50 kg/ha. Precision farming technologies including yield mapping, canopy sensing, satellite imaging and soil mapping are now common-place on farm. The Auto-N project sought to apply the information readily available from these technologies within an ‘Auto-N logic’ to improve the precision of N fertiliser decision making. The ‘Auto-N logic’ was derived from that used to estimate fertiliser N requirements as set out in the AHDB Cereals & Oilseeds guide Nitrogen for winter wheat – management guidelines; this guide suggests that N requirements should be calculated by subtracting Soil N Supply (SNS) from Crop N Demand (CND: grain yield x crop N content) and dividing by Fertiliser N Recovery (FNR); thus the ‘Auto-N logic’ uses yield and protein maps to inform estimates of CND, canopy sensing to inform estimates of SNS and soil sensing to inform estimates of FNR.
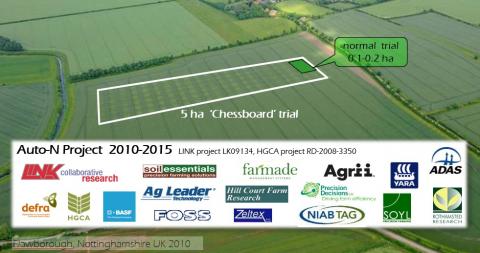
Novel chessboard N response experiments were set up on six commercial fields between harvest years 2010 and 2012 to quantify spatial variation in N requirement, to explain it in terms of CND, SNS and FNR, hence to develop the ‘Auto-N logic’. At each site, each farmer applied N as liquid urea plus ammonium nitrate (UAN) using the farm sprayer twice, in perpendicular directions, to create a systematic grid of ~400 plots (~12m × 12m) fertilised with N rates of 0, 120, 240 or 360 kg/ha; the area of each experiment exceeded 4 ha. Grain yields were measured by small-plot combine, grain samples were analysed for protein, and N harvest index and total N uptake were determined from pre-harvest grab samples. Values were then estimated for all variates and all N levels for all plots by kriging. Response curves were fitted, and N optima and their components (SNS, CND, FNR) were derived assuming 5 kg grain would pay for 1 kg fertiliser N. Within field variation in optimum N exceeded 100 kg/ha at all sites; spatial variation in optimal yield was greater than 2 t/ha at all sites and variation in SNS was generally greater than 50 kg/ha. Some of the spatial variation in optimum N was explained in terms of SNS and CND. However, the tendency for positive correlations between SNS and optimum yield was striking, and hindered complete explanation of spatial variation in optimum N: i.e. high yielding areas tended to have greater SNS, so the increased requirement from higher crop N demand was counteracted by the reduced requirement from higher SNS.
Spatial variation in CND and SNS was reasonably well estimated from the use of past yield maps and crop sensing, respectively; often, similar within-field patterns showed through for both. However, variation in FNR was also large and was unpredictable. Using clustering techniques, zoning, performance mapping or simple averaging of data from five farms, it was shown that past yield maps could be used usefully to estimate variation in CND. In addition, variation in SNS could be predicted from canopy sensing in early spring (an algorithm was developed based on sensed NDVI and thermal time since sowing). Calibrations for crop N uptake, biomass and crop N status (Nitrogen Nutrition Index) from canopy sensing were explored, but no rational basis could be found to justify their inclusion in the ‘Auto-N logic’.
Validation trials were set up with farmers on 11 fields in 2013 & 2014; these used adjacent tramlines to compare the Auto-N logic with the farm’s own practice, 50 kg/ha more N and 50 kg/ha less N. Evaluation of these trials along with economic analysis of the chessboard trials showed the benefits of precision in judging N requirements to be modest, whereas benefits of accuracy (proximity to the measured mean) were much greater. Whilst this work demonstrated the feasibility of automating judgements of N requirements within fields using precision information, the variability in CND, SNS and FNR, and crucially the interactions between them, meant that the use of such systems would not guarantee increased accuracy or precision of N use. The evidence suggests that variable rate N management can give only modest returns, even with a system making perfect predictions, if the field is already receiving the right average N rate.
The results showed that the most important decisions concern N use for whole farms, then for whole fields, then for areas within fields. Precision technologies can help with all of these, especially through comparisons of crops between and within farms. However, the most effective aspect of precision farming technologies is probably the empowerment of farmers to test retrospectively the effects of their N decisions (or indeed any decisions) on-farm. Given the variation in and unpredictability of N requirements between fields and between farms the only way farmers can know for sure whether their chosen N rates were right is to test yield effects of different N rates – this is relatively easy now, by simply applying (say) 60 kg/ha more and 60 kg/ha less to adjacent tramlines.
The chessboard trials initiated here have transformed our understanding of N responses and shown new possibilities for spatial experimentation, not only to empower on-farm testing, but to understand how soil variation affects husbandry outcomes. These trials show that N use is not the major cause of the very large spatial variation seen in yield. Thus, understanding the soil-related causes of yield variation should, and can, now become a priority for soil and agronomic research.
