fertiliser spreader

Nitrogen Use Efficiency is a widely used term increasingly discussed across industry and between farmers. However it can mean different things to different people, and is best defined with care.

Everyone agrees that nitrogen should be used efficiently and that we need to find ways to reduce nitrogen inputs whilst maintaining or increasing crop yield and quality.  However it can be misleading to make one ratio from two desirable outcomes; sometimes it is better to keep the two separate: high yield and low N input. 

Farmers are often advised to calculate NUE to help monitor their efficiency.  If a ratio is required, several definitions of NUE are used, each with a different nuance.  Broadly, they have one of two broad purposes, to sumarise:

  • Nutrient capture: The output of crop N per unit of N applied or available (%)   
  • Nutrient productivity: The output of crop dry matter per unit of N applied or available (kg DM/ kg N)

Neither is right or wrong, and both definitions are widely used. But it is important to be clear what is meant by NUE in any given context or by any individual or organisation, and what exactly is involved in the calculation. This is especially true if comparing metrics between farms or enterprises.  NFU and Defra are currently looking at appropriate KPIs for NUE. 

An important consideration is whether nitrogen fertiliser is applied with the objective of raising yields, or for the return of nitrogen as protein in harvested products. For most crops (feed wheat, barley, oilseed rape, linseed, sugar beet, potatoes, forage, grass) the prime role of nitrogen is to provide and sustain the photosynthetic machinery in the leaves to fix carbon and grow yield, stored as carbohydrate or oil. Some nitrogen is required for protein in the seed or harvested product, but mostly the farmer is not paid for this, and can even be penalised for it (eg malting barley, sugar beet).   So maximising offtake of nitrogen in the crop is not usually the farmer's objective, agronomically its best to keep as much N in the field as possible - Nitrogen in crop residues generally has minimal risk of loss where C:N ratio is high (eg straw).  Most leaching of N from arable soils occurs where soil N mineralises before winter, without being taken up by a crop.   

Everybody wants as much of any fertiliser N applied to get into the crop as possible. Ideally we would simply measure and calculate Fertiliser N Recovery. Unfortunately this is complicated by the uncertainties about N provided by the soil, and by variation in grain and straw nitrogen contents.    Some of the widely used definitions and calculations for NUE are listed below:

  • kg dry matter harvested / kg N available from all sources (soil + fertiliser + manure)
    • original definition by Moll et al. 1982
    • used widely in genetics studies comparing varieties (eg WGIN NUE trials) along with subcomponents:
      • N Uptake Efficiency (NUpE):  kg N uptake by crop / kg N available
      • N Utilisation Efficiency (NUtE):  kg DM produced / kg N taken up 
  • N output / N input (not necessarily including soil N)
  • N removed in harvested crop / N supply from all sources (soil N + manure N + fertiliser N)
    • Expressed as %.
    • Basis of NUE calculation in Yara NUE calculator
    • Advocated in June 2022 FACTS newsletter
  • Apparent Fertiliser N Recovery: kg N in crop minus N acquired from the soil (usually measured as N in unfertilised crop) / kg fertiliser N applied
    • Referred to as fertiliser NUE (NfUE) by CF 

Components of many of the NUE calculations above which support understanding nitrogen dynamics and balances are:

  • Crop N concentration (N% of harvested crop on DM basis)
  • Crop N offtake (DM yield x grain N%)
  • Crop N uptake (Crop N offtake + N in above ground residues (i.e. straw DM yield x straw N))
  • Nitrogen Harvest Index (proportion of N in the crop that is in the harvested product (crop N offtake/crop N uptake))
    • NHI is rarely measured on-farm, but a range of typical values can be used to estimate Crop N uptake from crop N offtake/NHI

Grain analysis is usually necessary for calculating N uptakes, N offtakes and to calculate N balances.  Grain analysis can also prove useful in diagnosing whether supplies of N (and other nutrients) to the crop have been deficient or excessive. 

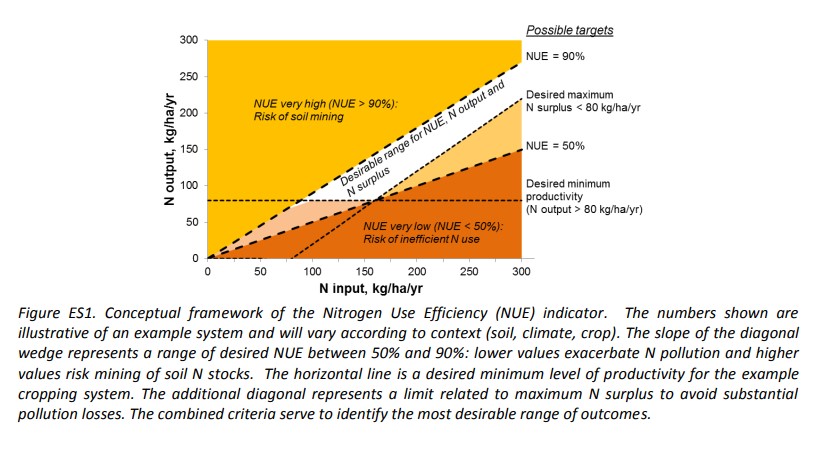
Highly efficient N use is not necessary a good thing; it may reflect that a crop is 'mining' N from the soil's organic matter.  Brentrup et al. (2015) provided the diagram below to show how both high and low NUE outcomes (i.e. N capture) can be undesirable in crop-soil systems:
N Balances: Going beyond crop-soil systems, it is important to note that, for agriculture as a whole, N balances may be calculated at field, enterprise, farm and region scales. N balances are used across EU, including for NVZ and regulatory requirements.  Key to this is that N harvested in crops is predominantly fed to livestock or people, who only retain a minority of what they consume. Thus, maximising N harvested from crops can ultimately prove counter-productive for the environment.  Ultimately the objective of crop producers must be to only export proteins that are essential to their end-users, for their crops to rely on recycled nitrogen as much as is possible, and for their farms to import as little 'new' nitrogen as possible.  Thus, farm system design and management of organic manures are both vital aspects of developing efficient use of N across all farms. 

Routes to improving NUE

  • Good nutrient management - right product, right rate, right place, right time

  • Enhanced Efficiency Fertilisers 

  • N efficient crop species and varieties

  • Human dietary choices, livestock nutrition, manure treatment, management, storage and spreading. 

 

Related Organisations

Content below is from across the PEP community and is not necessarily endorsed by Stewards or by PEP

Topic Comments

Discussion

I would stop confusing farmers and stick with Brentrup's definition of NUE  (N output versus N input)

I agree that soil N supply must NOT be included as it is not an input

and offtake in crop residues must be included in the output.

NUE should be assessed either over a whole arable (or grass) enterprise in any calendar year, or any particular field over a 4 year rotation.  Reasons as below

e.g. the higher NUE of first wheats is exaggerated because they take up N residues from the previous break crop that 2nd wheats don't, so this does not tell the farmer very much.  Needs to be over rotation.

Likewise nitrogen supply from manures works out over several years.  

I would advocate two NUE measures :-

a) N input is fertiliser N plus manure N plus fixation* (as Brentrup)

* AHDB would need to give ball park estimates of N fixed annually in legumes and clover leys; manure total N values are in RB209

this measure has ramifications in terms of losses to the environment 

b) N input in fertiliser only  (NUE fert)

This measure is best from the perspective of reducing fossil fuel use and fertiliser imports.   Use of legumes and manures** should be encouraged even if it worsens slightly the absolute NUE.  

So it might require slightly different target guidelines for NUE and NUE fert. 

** Unless soils already have enough SOM to achieve good workability and maximum yield.  Then putting yet more carbon into the soil via manures, cover crops or grass breaks will almost certainly reduce NUE in the a) definition, so Defra ELMS carbon incentives might need to be curbed to prevent this !

Microbial stimulation is generally bad for NUE (I think)

Trust this is of interest.  Stephen


1

Thanks Stephen,

I think the definition has to be contingent on the question that we are asking. And the question on farm is likely different to the question at industry level. I think we do need to recognise that the reason for applying N generally isn't to remove it in the harvested crop, but is to improve yields ... so there does need to be a measure of efficiency which is kg grain/kg N applied.  But I agree that monitoring and maximising the efficiency of uptake of applied N is very important, so we need an N recovery measure too. 

We are now starting a small study of YEN data with Defra to explore this further - let us know if you would like to be involved or kept informed. 

0

Hello,

Wished to share my thoughts about NuE...We hear many farmers who talk about the importance of NuE, and that they have aspirations to improve, or increase the efficiency with which the N on their farm is utilised.

My question is, whether they actually understand how to measure NuE. At a recent Weeds Meeting, 2 farmers spoke about their ambition to increase NuE on their respective farms. WHen questioned about their measuring NuE, it became obvious that they were not measuring NuE, they were introducing other forms of N into their system, and using N-tester and tissue tests to monitor nitrogen uptake and N levels in their crops. They were however, not actually measuring NuE, and so would not have any bench-marks against which to measure any improvements in NuE.

So, I believe the industry has used the concept of NuE as a 'buzz-word' rather than as an actual benchmark against which farmers can measure improvements in the efficiency with which nitrogen is actually used.

Rant over........thank you Dan!

Jamie Mackay (Agronomist)

1

Connected Content

Nitrogen is required annually by most crops (except pulses) to achieve yield and quality. Judging how much N to apply is a key part of nutrient management.

Plants need around 12 essential mineral nutrients to grow: Nitrogen (N), Phosphorous (P), Potassium (K), Magnesium (Mg), Sulphur (S), Calcium (Ca), Iron (Fe), Manganese (Mn), Zinc (Zn), Copper (Cu), Boron (B) and Molybdenum (Mo).

ADAS are planning a Nutrition Challenge to compare the effect of different nutrition programmes on winter feed wheat yield, N uptake and gross margin, in the 2022/23 season. This is particularly timely following the recent dramatic rise in nitrogen fertiliser prices, which has forced the industry to re-examine nutrition strategies. Objectives of the project are to showcase good nutrition products and practices so that farmers are equipped and encouraged to use fertiliser better, for the benefit of the environment and their own gross margins.

N2 Applied has developed a technology that enables local production of fertiliser using only livestock slurry, air and electricity, – dramatically reducing harmful emissions and improving yield at the same time. The technology adds nitrogen from the air into slurry, which increases the nitrogen content. The reaction prevents the loss of ammonia and eliminates methane emissions, making it a real solution helping to achieve climate target commitments on an industrial scale.

A range of products are commercially available that claim to enable more efficient nutrient uptake, allowing less nutrient to be applied as fertiliser.

Share your ideas and experience of how to improve nutrient efficiency and reduce dependence on artificial fertilisers

Plant breeding is the science of adapting the genetics of plants to produce more desirable characteristics, in agriculture these typically include improved yield, in-field performance and end use quality.

Soil N Supply is the nitrogen available to the crop from soil during the season. It is the most important component of estimating a crop's nitrogen requirement.

With support from Defra the YEN database was analysed to investigate Nitrogen Use Efficiency (NUE) metrics and how the variation in these metrics are influenced by parameters such as soil, crop performance and crop management.

Grain protein content and quality is one of the most important determinants of functionality of cereals, defining whether wheat grain is suitable for milling for bread making or biscuit making.

This Topic doesn't yet have a Stewarded summary, but connected groups, content and organisations show below. Click the 'Ask to Join' button if you would like to be a Steward for this Topic and provide a summary of current knowledge and recommend useful resources, organisations, networks and projects. "Like" this Topic if you would like to see it prioritised for providing a wikipedia style summary.

Annual conference of International Society Fertiliser at Robinson College, Cambridge, on 7-9 December 2022

Helping farmers profit, naturally.  Our mission is to support farmers in the transition to more sustainable, regenerative farming practices. 

Scientific paper setting out how GHG emissions from agriculture could be reduced through more efficient production and use of N fertiliser. Gao, Y., Cabrera Serrenho, A. (2023) Greenhouse gas emissions from nitrogen fertilizers could be reduced by up to one-fifth of current levels by 2050 with combined interventions. Nature Food. https://doi.org/10.1038/s43016-023-00698-w  

One of the few positives from the current fertiliser crisis is that it will at least force al

Hello, Wished to share my thoughts about NuE...We hear many farmers who talk about the

Tailoring nitrogen rates to optimise yield from modern spring barley varieties and hit the qualit

The AHDB Recommended List is part of the fabric of arable farming and is the engine drivi

Could applying molybdenum as a spring fertiliser coating fire up nitrogen conversion and play a k

Article describing Map of Ag project with Kelloggs working with farmers to monitor crops in seaso

Presentation from Daniel Kindred at CropTec 2021 on how to deal with higher nitrogen fertiliser p

Managing nutrients effectively is crucial for our soils, crops, livestock and environment. There are many resources and initiatives available to help. 

WWF funded report by Stockholm Environment Institute at University of York and UK-CEH looking at issues around nitrogen use in the UK 

Co-ordinating Global Wheat Research

This report aims to explore N cycling in livestock production systems, highlighting the roles of different forms of N, particularly its vital role in protein production, and where losses occur from the cycle.

The trial will evaluate the long-term effects of pulses in an arable rotation, particularly the effect on available N to following crops. Objectives are: To evaluate the effects of winter beans, winter bean/ winter wheat intercrop and spring beans on soil nitrogen supply annually over 5 years. To evaluate the effects of species and species mixtures on GHG emissions. To evaluate impacts on soil structure and health resulting from cropping differences.

In this Issue Brief, we delve into the central role of nutrient use efficiency in achieving the five aims of responsible plant nutrition and we present the major indicators to use for different purposes.

The ADAS soils and nutrients team will share and discuss results from our recent cover crop research with Affinity Water, Anglian Water, and Portsmouth Water.

The study measured the N available after spring-sown peas, field beans or autumn sown cereals in eastern England and the subsequent response of winter wheat to fertiliser nitrogen.  

Accounting for fertiliser and feed prices, it calculates the cost benefit of applying nitrogen to grassland. Use this tool to work out the cost versus the benefit of applying nitrogen fertiliser to grassland. Accounting for fertiliser and feed prices, it calculates the cost of nitrogen application and then compares with the feed value of grass. This will help with the decision on whether it is more cost effective to apply nitrogen fertiliser to grassland or purchase feed instead.  

Understanding the factors that impact nutrient use efficiency (NUE) is key to improving nutrient management planning.

At a time when sustainable agriculture and environmental stewardship are vital, improving the nutrient use efficiency (NUE) of organic manures is a crucial goal.

In the face of rising fertiliser prices and environmental concerns, it is crucial to optimise nitrogen use efficiency, NUE, in agriculture. 

Multi-species grassland leys in crop rotations can improve soil quality and nutrient efficiency, particularly with legume inclusion, which enhances nitrogen availability and reduces the need for mineral fertilisers. 

Estimating soil nitrogen supply (SNS) is an important step in nitrogen (N) decision-making for arable crops.

Paper from 2010 AAB conference: Kindred, D. and Sylvester-Bradl

Write whatever you want here - this is the main section. You can add links, add pictures and embed videos. To paste text from elsewhere use CTRL+Shift+V to paste without formatting. Add videos by selecting 'Full HTML' below, copying the 'embed html' from the source page (eg Youtube), clicking 'Source' above and pasting where you want the video to appear.
You can upload an image here. It can be jpg, jpeg, gif or png format.
Upload requirements

You can upload a file here, such as a pdf report, or MS Office documents, Excel spreadsheet or Powerpoint Slides.

Upload requirements
Authors Order
Add Authors here - you can only add them if they already exist on PEP. Just start writing their name then select to add it. To add multiple authors click the 'Add another item' button below.

Please ensure that you have proof-read your content. Pages are not edited further once submitted and will go live immediately.

Configure the meta tags below.

Use tokens to avoid redundant meta data and search engine penalization. For example, a 'keyword' value of "example" will be shown on all content using this configuration, whereas using the [node:field_keywords] automatically inserts the "keywords" values from the current entity (node, term, etc).

Browse available tokens.

Simple meta tags.

The text to display in the title bar of a visitor's web browser when they view this page. This meta tag may also be used as the title of the page when a visitor bookmarks or favorites this page, or as the page title in a search engine result. It is common to append '[site:name]' to the end of this, so the site's name is automatically added. It is recommended that the title is no greater than 55 - 65 characters long, including spaces.
A brief and concise summary of the page's content, preferably 150 characters or less. Where as the description meta tag may be used by search engines to display a snippet about the page in search results, the abstract tag may be used to archive a summary about the page. This meta tag is no longer supported by major search engines.

Meta tags that might not be needed by many sites.

Geo-spatial information in 'latitude; longitude' format, e.g. '50.167958; -97.133185'; see Wikipedia for details.
Geo-spatial information in 'latitude, longitude' format, e.g. '50.167958, -97.133185'; see Wikipedia for details.
Robots
A comma-separated list of keywords about the page. This meta tag is used as an indicator in Google News.
Highlight standout journalism on the web, especially for breaking news; used as an indicator in Google News. Warning: Don't abuse it, to be used a maximum of 7 times per calendar week!
This meta tag communicates with Google. There are currently two directives supported: 'nositelinkssearchbox' to not to show the sitelinks search box, and 'notranslate' to ask Google not to offer a translation of the page. Both options may be added, just separate them with a comma. See meta tags that Google understands for further details.
Used to rate content for audience appropriateness. This tag has little known influence on search engine rankings, but can be used by browsers, browser extensions, and apps. The most common options are general, mature, restricted, 14 years, safe for kids. If you follow the RTA Documentation you should enter RTA-5042-1996-1400-1577-RTA
Indicate to search engines and other page scrapers whether or not links should be followed. See the W3C specifications for further details.
Tell search engines when to index the page again. Very few search engines support this tag, it is more useful to use an XML Sitemap file.
Control when the browser's internal cache of the current page should expire. The date must to be an RFC-1123-compliant date string that is represented in Greenwich Mean Time (GMT), e.g. 'Thu, 01 Sep 2016 00:12:56 GMT'. Set to '0' to stop the page being cached entirely.

The Open Graph meta tags are used to control how Facebook, Pinterest, LinkedIn and other social networking sites interpret the site's content.

The Facebook Sharing Debugger lets you preview how your content will look when it's shared to Facebook and debug any issues with your Open Graph tags.

The URL of an image which should represent the content. The image must be at least 200 x 200 pixels in size; 600 x 316 pixels is a recommended minimum size, and for best results use an image least 1200 x 630 pixels in size. Supports PNG, JPEG and GIF formats. Should not be used if og:image:url is used. Note: if multiple images are added many services (e.g. Facebook) will default to the largest image, not specifically the first one. Multiple values may be used, separated by a comma. Note: Tokens that return multiple values will be handled automatically. This will be able to extract the URL from an image field if the field is configured properly.
The URL of an video which should represent the content. For best results use a source that is at least 1200 x 630 pixels in size, but at least 600 x 316 pixels is a recommended minimum. Object types supported include video.episode, video.movie, video.other, and video.tv_show. Multiple values may be used, separated by a comma. Note: Tokens that return multiple values will be handled automatically.
A alternative version of og:image and has exactly the same requirements; only one needs to be used. Multiple values may be used, separated by a comma. Note: Tokens that return multiple values will be handled automatically. This will be able to extract the URL from an image field if the field is configured properly.
The secure URL (HTTPS) of an image which should represent the content. The image must be at least 200 x 200 pixels in size; 600 x 316 pixels is a recommended minimum size, and for best results use an image least 1200 x 630 pixels in size. Supports PNG, JPEG and GIF formats. Multiple values may be used, separated by a comma. Note: Tokens that return multiple values will be handled automatically. This will be able to extract the URL from an image field if the field is configured properly. Any URLs which start with "http://" will be converted to "https://".
The type of image referenced above. Should be either 'image/gif' for a GIF image, 'image/jpeg' for a JPG/JPEG image, or 'image/png' for a PNG image. Note: there should be one value for each image, and having more than there are images may cause problems.
The date this content was last modified, with an optional time value. Needs to be in ISO 8601 format. Can be the same as the 'Article modification date' tag.
The date this content was last modified, with an optional time value. Needs to be in ISO 8601 format.
The date this content will expire, with an optional time value. Needs to be in ISO 8601 format.

A set of meta tags specially for controlling the summaries displayed when content is shared on Twitter.

Notes:
  • no other fields are required for a Summary card
  • Photo card requires the 'image' field
  • Media player card requires the 'title', 'description', 'media player URL', 'media player width', 'media player height' and 'image' fields,
  • Summary Card with Large Image card requires the 'Summary' field and the 'image' field,
  • Gallery Card requires all the 'Gallery Image' fields,
  • App Card requires the 'iPhone app ID' field, the 'iPad app ID' field and the 'Google Play app ID' field,
  • Product Card requires the 'description' field, the 'image' field, the 'Label 1' field, the 'Data 1' field, the 'Label 2' field and the 'Data 2' field.
A description that concisely summarizes the content of the page, as appropriate for presentation within a Tweet. Do not re-use the title text as the description, or use this field to describe the general services provided by the website. The string will be truncated, by Twitter, at the word to 200 characters.
By default Twitter tracks visitors when a tweet is embedded on a page using the official APIs. Setting this to 'on' will stop Twitter from tracking visitors.
The URL to a unique image representing the content of the page. Do not use a generic image such as your website logo, author photo, or other image that spans multiple pages. Images larger than 120x120px will be resized and cropped square based on longest dimension. Images smaller than 60x60px will not be shown. If the 'type' is set to Photo then the image must be at least 280x150px. This will be able to extract the URL from an image field if the field is configured properly.
The MIME type for the media contained in the stream URL, as defined by RFC 4337.